Akoya Biosciences recently held their inaugural Spatial Day in December, followed by a presentation at 40th Annual J.P. Morgan Health Care Conference (JPM), detailing the launch of an updated chemistry for all their platforms (Spatial Biology 2.0) and the launch of the Fusion, a new platform which fills the gap between the PhenoCycler (formerly CODEX) and PhenoImager (formerly Phenoptics). Following the two presentations, I had the opportunity to catch up with Niro Ramachandran to discuss the announcements and updates. You can find a transcript of our discussion below.
Niro Ramachandran, PhD, is the Chief Business Officer (CBO) of Akoya Biosciences and has helped guide the company’s various business segments since mid-2020. Prior to joining Akoya, Niro served as the VP of Spatial Biology at NanoString Technologies and has an extensive background in protein array technologies.
Niro, I really appreciate you taking time to join me today and get to chat about Akoya Biosciences and the exciting announcements of the past couple months. I have covered Akoya quite a bit in the past for DeciBio’s readers through conversation with Brian and Garry, so, we can just jump straight into the announcements from the past few months at the inaugural Spatial Day and JPM. Starting with Spatial Biology 2.0, the updated chemistry brings a handful of changes, and now allows for the analysis of hundreds of targets across a tissue sample in a matter of minutes. How do you think this change is really going to impact the way Akoya's platforms are being used across all your customers?
Today, when I look at the spatial biology landscape the most prevalent solutions are from Akoya, NanoString and 10x. The 10x and the NanoString solutions fall under the category of spatial profiling because it's about taking the markers out of small regions of the tissue and analyzing them ex situ with a very deep plex level. By contrast, our solutions are based on the principle of spatial imaging and analyzing markers in situ where the focus is more on achieving single cell resolution and whole slide coverage. In the current ecosystem, spatial imaging and spatial profiling solutions are very complementary. They just give you different flavors of answers and customers get to choose based on their research needs. In the big question between plex versus resolution, customers who value resolution may tend to lean towards the Akoya system. The ones that value plex will use Visium or GeoMx. The major application in spatial biology is spatial phenotyping where the identity of each cell in the context of the tissue is determined. This application is best served by spatial imaging approaches that provide that single cell resolution across the whole tissue section.
Historically, for imaging-based spatial phenotyping, the challenge has been the speed of imaging of multiple markers across whole tissue sections; it can be really slow. Today, for a typical customer, if they’re running the PhenoCycler coupled to a third-party microscope, it may take them a full day to image 20 or 30 targets across a tissue section that’s 10 mm by 10 mm, and that generates a file that’s over a terabyte in size. So, for one thing, it takes a long time to get all that real estate covered via imaging, and second, it takes a lot of infrastructure to house these files. Because these problems are so inherent in our own customer base, we are aware of it every single day, while someone who's doing spatial profiling may not, because they’re not generating terabytes of ultra-high-plex imaging data. The challenges you encounter in NGS-based spatial profiling and imaging-based spatial phenotyping are quite different.
So, the launch of our Spatial Biology 2.0 solutions, and other new capabilities, were designed to solve the challenges that our customers have wanted to solve over the past few years, as they move into the ultra-high-plex imaging space. The two key aspects we wanted to address were: one, to make the system go faster and two, address the data management side. One of the surprising secrets in the life sciences industry was that the imaging technology we acquired from PerkinElmer had solved the plex-speed-performance quandary. When you're imaging three, four, five, or six targets, if it takes 15 minutes or 20 minutes longer, you may not really feel the difference in a typical workflow. Where that speed starts to materialize is when you start to get into dozens or even hundreds of targets, when analysis times get measured in days instead of minutes. This is where speed matters.
The thing that’s really exciting for us around Spatial biology 2.0 is how to leverage the inherent speed of the PhenoImager technology we acquired. To me, speed is a capability, not a product attribute, and so if you have speed, how can you turn that into an attribute customers can use? Speed translates across three different axes: sample coverage, plex, and sample throughput. The researcher gets to dial this in. For example, a researcher could go, “If I have a really fast system, maybe I’ll go from 30-plex to 100-plex or even 1,000-plex.” They can use that speed to analyze many more targets than they could have before. Alternatively, they can move from 1 mm x 1 mm to 3 mm x 3 mm sections, or even an entire tissue section because it’s so fast. And, lastly, instead of processing one sample per day, you could do five or ten a day. Projects can begin to scale. That is the most exciting part about Spatial Biology 2.0 to me. We’re investing in speed so our customers can then translate this into any of those three attributes.
Of course. You covered quite a bit there in that first answer, but one thing I don't think you mentioned as part of Spatial Biology 2.0 is the new RNA detection chemistry to address transcriptomics, which really expands the compatibility of the barcoded antibody system beyond just what the PhenoCycler, formerly CODEX, has been capable of. You mentioned a synergistic and complementary relationship between Akoya’s platforms and other spatial profiling approaches, but are there any customers, groups, or applications which you think are best suited for transcriptomic work on Akoya’s instruments?
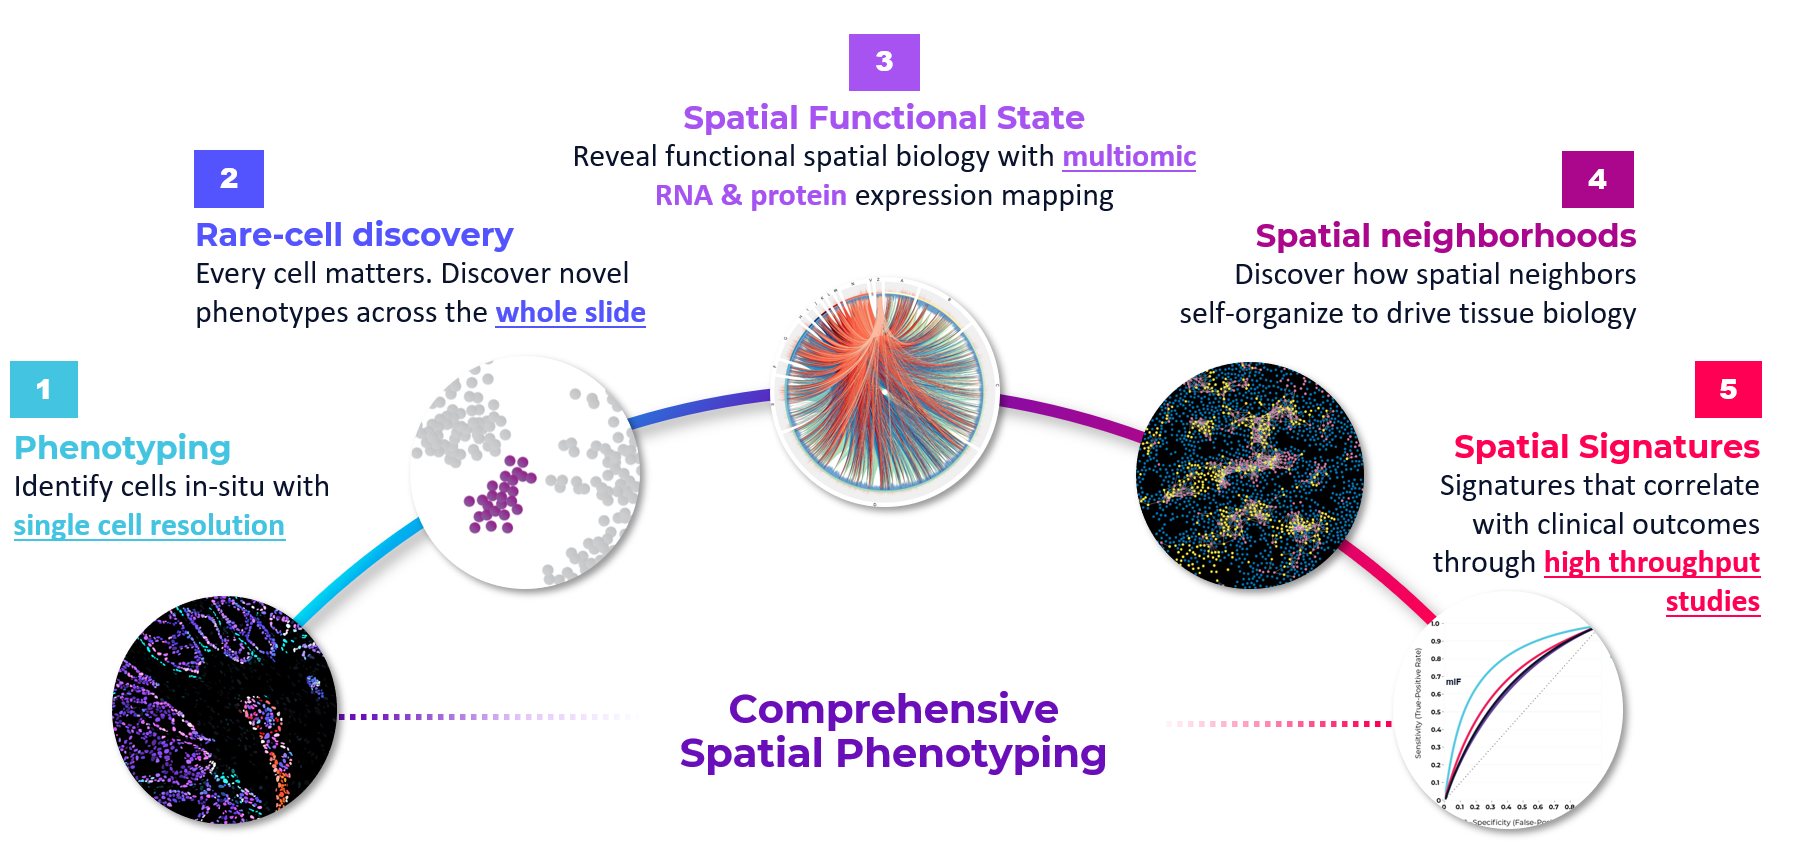
By looking at the publications in spatial biology and listening to our customers, we’re able to neatly package the application space into five categories. The first category we typically think about is spatial phenotyping—cataloging all the cells in a tissue and seeing what’s there. The second category is where you are hunting for rare cell populations, like what we have done with single-cell RNA-seq. The ability to detect 1% or 0.1% of cells which cannot be easily detected by traditional methods. The third category is research on cell state and gaining a greater understanding on activation states in a tissue. The fourth focuses on spatial neighborhoods and understanding how cells spatially organize and interact with each other to influence tissue behavior. And the last one is spatial signatures—leaning towards clinical applications, like patient stratification or risk.
We look across these five categories and ask, “Well, when do you need protein? When do you need RNA?” An obvious use case for RNA is the third category, spatial activation states, where transcriptomic analysis allows us to look at which pathways are activated or deactivated. Proteins, on the other hand, are great for determining cell types. The various combinations of RNA and protein markers are broadly applicable across those five buckets and a researcher can choose to dial into either approach depending on their study goals. Spatial signatures and clinical applications will probably lean heavily towards the protein markers because it’s a more stable readout. You could also imagine these being done sequentially—maybe you start with cell typing via proteins and then do a deep dive on RNA. When I think about transcriptomics, and multiomics, you may need to do more protein or more RNA depending on which of those applications you’re interested in. Some customers are going to want more proteins, others more RNA, and some might want an equal balance of both.
You actually addressed what was going to be my next question there asking about the interplay of RNA and protein targets. Looking towards the future, today, as we've discussed previously, most clinical markers are in the protein realm. There's a lot of excitement in the research field around transcriptomics and whatnot, but how do you expect the use of multiomic analysis to evolve over the coming years? Is this something you think will make it further towards translational and clinical realms in the near- to mid-term?
I would love to see multiomic applications in the clinic. I think it would be an elegant assay, but obviously when you go to the clinic, you're going to reduce the assay down to its simplest form. Minimum complexity with maximum information and predictivity. With that requirement in mind, I would imagine the reality is that 80-90% of the markers are probably going to be protein just because of the mix of experience, performance, and reliability. There are also going to be people that are cautious about pushing the levels of plex and expanding beyond proteins. Having said that, there is probably room for multiomics, maybe for 10% to 20% of the clinical applications.
There’s a recent publication from Nir Harcohen & Aviv Regev’s lab at the Broad institute and Mass General Hospital (Pelka K, et al. Cell 2021) where they developed a multiomic assay on our PhenoImager platform. The assay included a handful of protein markers to detect cell types and RNA markers to detect secreted targets. An assay like this, with additional validation, could be deployed as an LDT in a clinical setting. This is good example of what a multiomic assay in the clinic could look like and I’m hoping there’s more of this.
That sounds like an interesting study on how a spatial multiomic assay can move from discovery into translational research, which brings me to my next question. Beyond the updated chemistry, though, the Fusion instrument, which sits between PhenoCycler and PhenoImager in the discovery-clinical continuum was also announced in the past couple months, and then commercially launched in mid-January. For our readers who may not be familiar with this new platform, could you provide a bit of context and background on the Fusion and who this product is designed for?
The PhenoImager Fusion is designed to serve two different use cases. Today, we offer the PhenoImager-HT (formerly, Vectra® Polaris), which is a high-throughput system designed to process 300 slides in a given week, and it’s been regarded as the most sensitive and fastest platform on the market because of the Opal chemistry and the imaging capability. That system really appeals to core labs or CROs that are in a high-volume setting, potentially supporting clinical trials. The PhenoCycler Fusion is attractive to an individual researcher who wants the same technology, the same imager, but at the scale of an individual lab, which can be a few dozen or up to 100 samples per week. The second use case, as alluded to by the name itself, is the integration with our PhenoCycler platform and fusing the benefits of our two technology stacks, cycling and imaging. With the Fusion, researchers can now turn the PhenoCycler into a high-powered discovery platform to bring the best ultra-high-plex and high throughput capabilities to an individual lab. Today you may take 2-3 days to image and fully analyze a whole tissue section with PhenoCycler and a third-party microscope, but with Fusion a whole section can be scanned in 10-15 minutes depending on the size of the image or the plex level. It’s much, much faster. This means our customers can shift from 20-plex to 100-plex or even higher, and from 1 sample per day to multiple samples per day.
In addition to this speed and scale, the system has a proprietary data compression format which produces ready-to-analyze QPTIFF files directly from the instrument. Typically, these imaging datasets can be many terabytes in size and now it’s rapidly processed into manageable gigabyte-sized files. When you combine that with the ability to push to higher plex limits and allow more samples, it makes large scale studies much more manageable. The biggest difference from a user experience is that you can begin to analyze the images the same day. Before you’d have to start your experiment and wait until the following day or even later to begin to process the data, but now you could start an experiment in the morning and be visualizing the data in the afternoon. They don’t have to wait for terabytes of data to be generated and processed.
I can definitely imagine having these images immediately available would be quite empowering for researchers. You can more easily course-correct if something looks off with the first image. The Fusion system, though, really sounds like a powerful discovery and translational tool connecting the hundreds of markers which can be covered in the discovery setting, to the low- to mid-plex assays in the translational realm being run on the PhenoImager line. How do you expect this new end-to-end capability to change how Akoya’s platforms can impact biomarker discovery for applications like immuno-oncology or other therapeutic areas?
It is sometimes good to compare how we have done this in the past and see what might be different in the future. If you look at the sequencing world, we did not initially set out to build a system to take it all the way from discovery to the clinic. It happened over time as the discovery research matured, and it filtered into translational applications. Once it matured in the translational setting then it made its way into the clinic. One of the things about spatial biology that excites me the most is that the acceleration in discovery and clinical research is happening simultaneously, which is new. There are growing needs for spatial solutions in discovery, translational and clinical research, all at the same time, but the requirements are different. It’s this new market dynamic that we haven’t really seen before in life sciences and that has fueled the need to develop platforms that serve varying needs across these three research areas.
This is especially important in immuno-oncology, as the clinical assays being used today are mostly spatial but with just one or two biomarkers. The emerging translational assays are also mostly spatial and there is a growing need to discover new information about the tumor microenvironment. Because of this, our customers are considering the needs of their discovery, translational and clinic research simultaneously, and, therefore, our product development strategy cannot be sequential. We have to make products that can—reasonably—serve the needs of all three of these research areas. The launch of the Fusion is not only the fusion of capabilities within Akoya between the PhenoImager and PhenoCycler, but also a fusion of the workflows, seamlessly combining discovery to translational to clinical. We believe the need is there today.
This is really the first time I’ve seen a market need like this, and it required us to re-think how we do product development and commercialization to serve all those three needs simultaneously. Because of this, we’re seeing a hyper acceleration of discoveries making it towards the clinic far faster than we’ve seen previously. Most would say it takes 5 to 7 years for something in discovery to reach the clinic. The question is if you have the right tools and capabilities, could you cut that time in half? To me, this unknown factor is probably one of the most exciting things about spatial biology. The need is certainly there, we just need to enable it.
Getting back to some of those capabilities, the Fusion, as you noted earlier, has a built-in microscope, and works in conjunction with the PhenoCycler and PhenoImager. The PhenoCycler has always been compatible with fluorescent microscopes, and Akoya has penned agreements with Zeiss, Nikon, CrestOptics, and Andor previously. How do you expect Fusion to fit in the workflow of current PhenoCycler users considering their pre-existing investment in microscopy?
I think this deserves a multi-part answer. To begin with, some customers love Zeiss, others love Nikon and so on. They’re comfortable with them. They understand them. For this customer, we’re able to provide them with the PhenoCycler, and through our partnership, link it to a microscope they’re comfortable with. There’s another customer who may be excited about spatial biology but can only afford to invest $100,000 and attach it to an existing microscope. We enable that as well. Those customers, down the road, may be able to upgrade to a Fusion system when funding becomes available. For customers that have funding today and would like to accelerate their spatial biology studies with higher plex, higher sample throughput and rapid whole slide imaging, PhenoCycler-Fusion would be the preferred solution.
Another initiative that’s exciting for us is the Imaging Innovators (I2) Network. We had many applications for this program and selected over 10 sites who are pushing the boundaries of new spatial applications. Some of these ideas involve applications which we hadn’t—and wouldn’t have—thought of ourselves. Along with our microscope partners, we provide these researchers with the platform capabilities, but they really drive the ideas and breakthroughs. They push our platforms beyond where we thought they could go. This is an exciting area of open innovation and collaboration for us.
So, getting back to your question, for customers who know what they want, PhenoCycler and Fusion can serve them. For customers who have a microscope or have a preferred microscope, PhenoCycler can serve them well. If there are budget constraints, we can still serve them. For those who want to push the boundaries of what’s possible, we can serve them as well. That’s the beauty of how our platforms work and the partnerships we have formed.
Definitely. One last question on Fusion. You’ve highlighted the platform’s throughput, and one thing that was covered extensively during Spatial Day was the ability to map a million cells in 10 minutes. It was a key point that you really drove home. Prior to this call we had recently discussed my white paper which came out in collaboration with Mass General, which only covered plex, resolution, and cost, but wasn’t able to cover things like whole slide capabilities or throughput, both of which you have covered quite a bit during this conversation already. Given that those are also important metrics in this market, what have you heard from customers on these capabilities and how is Akoya’s portfolio evolving to meet those needs?
As discussed earlier, there’s already the mix of spatial imaging and spatial profiling which impacts the considerations for resolution, but that is largely dependent on the customer. They’re generally deciding between whole transcriptome or whole tissue coverage. If they want whole tissue and single-cell resolution, Akoya is the way to go. We believe that is going to be the dominant need in spatial biology for 3 main reasons.
First, when we talk to our customers, they often value single cell resolution and whole slide analysis with as much plex as they can get, because they only get one shot with the sample. Once they create the dataset, they can come back years from now and leverage new data analysis or AI solutions to re-analyze the samples and generate new insights. If you have to pick a region of interest today, then you have to place a bet on that region. It isn’t futureproof. That’s a major driver.
Second, in basic research, you don’t usually know what part of the tissue to look at, and you want to be able to look at the entire tissue section to learn what’s there. A great example of this was shown in a webinar by Kai Kessenbrock, who’s doing cell atlassing work. By imaging the entire breast tumor tissue, he discovered a rare cell population that had under 1% abundance. He needed the entire tissue section to discover it—there’s no way you’d be able to determine a cell population like that through regions of interest. This need for unbiased discovery is the second driver.
Lastly, consortia like the HubMap (Human Biomolecular Atlas Program) and HCA (Human Cell Atlas) which are actively cataloging cells and tissues, in both healthy and diseased samples, absolutely need single-cell resolution. Profiling or region of interest approaches would be insufficient for these programs.
I believe these are the major drivers behind getting to tissue-wide, single-cell resolution. On top of this is the requirement for speed, because if you don’t have speed, you’re limited to only analyzing smaller sections of the tissue or a limited number of samples or limited plex. So, while it’s not as widely discussed as plex and resolution are today, I would argue that speed and throughput will become more and more important over the next 12 to 18 months. Various manufacturers have acknowledged this—almost every platform that is expected to come out in the next two to three years will be a spatial imaging platform. There will be five to ten high-resolution imaging platforms available to consumers for spatial imaging. Why? It’s because that’s where the biggest need is today. Researchers want to be able to look at a tissue section at a single-cell level across a whole slide. Once that need is addressed, the need will naturally shift to how quickly that type of imaging can be done.
So, today, customers may be choosing based on plex and resolution alone, but tissue coverage and throughput will become more and more important as more technologies enable high-plex and high-resolution experiments. The approach and perspective we have taken in our product development is, “what are the needs today, and what are they going to be tomorrow?”
It does feel like there’s a new platform announcement or publication every other week in the space, and it’s been that way for a couple of years now. We have also seen, as you alluded to, a lot of the players producing platforms which enable spatial profiling or region of interest-based approaches announcing platforms that are single-cell capable. As we’ve also discussed, these platforms generate massive amounts of data that has historically been difficult to analyze. Akoya is obviously trying to rectify this historic challenge, though, through both the improved compression methods but also through the partnership with PathAI. Thinking about the PhenoCycler, the Fusion, and the PhenoImager, you shift from high-plex to moderate-plex as you go down that list. How do you expect customers to pare down their discovery assays to clinical assays considering the historic difficulties with co-expression analysis at plex? What can customers expect from Akoya to assist in this process?
Today, I think this comes down to table stakes. Being able to compress the images and move around the files, those are just table stakes in this industry. Everyone must figure out how they’re going to do it. Ultimately, we’ll need to come to a market consensus on a compression method. QPTIFF has had a long history of being used, but if the industry conforms to a different method, we can adapt. I think it’s inevitable that this consolidation happens in the next two years. At that point, it really comes down to the analysis piece. There are a few options on this front. There are rudimentary approaches where you can take the two-dimensional tissue images and turn them into one-dimensional datasets, and through regular number crunching you can analyze the data as we’ve done with sequencing data. However, I’m more excited by this new wave of AI-driven analysis for spatial data. As you know, our collaboration with PathAI ultimately comes down to applying AI to our platforms’ images. Once these technologies are perfected on H&E and other low-plex applications, it’s only a matter of time until these algorithms become regularly applied to ultra-high-plex spatial images. We’ve had collaborations for this on multiple fronts now, between our recent partnership with PathAI and existing work on AstroPath™ with Johns Hopkins University. We’re constantly looking for opportunities for us to collaborate and expand our understanding on how this analysis can be conducted and how to bring it to our customers.
Thinking back to Spatial Day, there were a number of speakers, one of them being Kurt Schalper from Yale. In his talk he touched on how to transition multiplexed quantitative immunofluorescence into the clinic, commenting on the need for standardized results interpretation and reporting. As you know, for the past few years it's been the wild west with how people are analyzing these data sets. Considering Akoya is one of the key providers in spatial omics, what can your company and other major providers do to help standardize this analysis and ensure spatial phenotyping platforms impact the clinic?
In the clinic today, a pathologist can look at a sample under the microscope and make a call with a H&E stain or other individual markers, and the use of AI and digital pathology today has simply assisted in that process. Once you get into multiplex assays, it’s a massive change, it’s going to be hard for someone to look at a four-color or six-color image and decipher the overlays. There must be ways to quantify what this means.
We have an ongoing collaboration with Dr. Scott Rodig at Dana Farber and several others that are exploring clinical applications using multiplexed imaging. What they do is run an algorithm to report out cell types all the way through co-expression analysis. They get the primary image data, but also the secondary data on top of it. So, let's consider going from qualitative visual data to quantitative cell-segmentation and cell phenotyping data that's presented as a secondary data set. As we get a deeper understanding of these layers of data that have predictive information, going from just visual data to quantitative datasets will become more common, and from there we can create algorithms which can easily detect those cell phenotypes. From there, you’ll start to see the next layer up, analyzing spatial and cellular neighborhoods which will be the tertiary data set. What we’re looking for in the clinical space are the different layers which can have predictive value and how we can report that out. The only way the world starts learning is by doing the studies and gathering the clinical evidence needed to support this type of analysis and standardization. To this end, we’re actively collaborating with several leading KOLs to support studies that can accelerate this process and will share updates in coming months.
That’s definitely a long road to get there. As a final question on my end, obviously you’ve been involved in the spatial field since the early, early days over the past decade where you were a champion of this technology, as Steph would say, “before it was cool.” We’ve already covered the interplay of the spatial profiling and spatial imaging technologies and how the market is changing there, but I’d like to get a bit more context on the relationship between spatial approaches and single-cell analysis, as you’ve brought it up a few times through the discussion. How do you see those playing together in a complementary or non-complementary manner?
Without the innovations happening in spatial biology, single-cell analysis, in suspension, would be dominating tissue analysis as well. Today, I think that single-cell analysis has been a major driver of spatial analysis, simply because of the curiosity sparked by that single-cell data. Researchers are thinking, “I just cataloged all these cell types, but how are they organized and related to each other in the tissue?” As spatial technologies get better and better, you will be able to do more and more of your single cell analysis directly on tissue without the need for analysis in the suspension format. As the technology gets more robust and accessible, it is just a matter of time before you will just start with spatial analysis as your first step.
Of course, and, assuming everything becomes cost-competitive, and the analysis is manageable, why wouldn’t you want the extra spatial context? With that, Niro, I really appreciate the time. Are there any other final thoughts you’d like to share to conclude the interview?
I’ll share two thoughts here. One is, as we talked about before, this market is going to reach a consensus point in the next two to three years, at which point I really hope the market accelerates and explodes in a way we haven’t seen before. For the second, there’s a lot of ongoing discussion of how real is the clinical application—is it going to be in my lifetime or the next lifetime? In the NGS world, people would probably argue it took 7 to 10 years to reach the clinic, but early in that timeline many said NGS would never be in the clinic. Spatial has a different aura to it. Everyone believes it will be in the clinic, but how soon? I think we’re closer than we think to breaking into clinical applications. I expect in 2-3 years, there will be a critical mass of clinical evidence that will be transformative to this market.
Comments and opinions expressed by interviewees are their own and do not represent or reflect the opinions, policies, or positions of DeciBio Consulting or have its endorsement. Note: DeciBio Consulting, its employees or owners, or our guests may hold assets discussed in this article/episode. This article/blog/episode does not provide investment advice, and is intended for informational and entertainment purposes only. You should do your own research and make your own independent decisions when considering any financial transactions.

.png)